Hey there, fellow EKG enthusiasts! After 15 years of staring at heart rhythms in the back of a moving ambulance (while trying not to spill my coffee), I’ve developed quite the appreciation for one of cardiology’s more interesting findings – the Osborne Wave, or as the cool kids call it, the J-Wave.
Now, before you roll your eyes thinking “great, another EKG pattern to memorize,” let me tell you – this one’s actually pretty fascinating, and spotting it might just make you look like a rockstar during your next case review.
What in the World is an Osborne Wave?
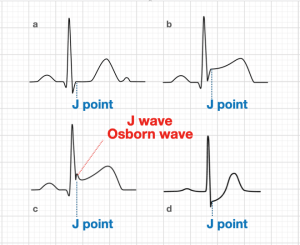
Picture this: you’re looking at your standard EKG, and right at the end of the QRS complex, where it meets the ST segment, you see what looks like someone tried to draw a tiny dolphin jumping out of the water. That’s your Osborne Wave! It’s that little extra upward deflection that appears just when you thought the QRS was done doing its thing.
 Source- Life In the Fast Lane
The Real Deal Behind the Wave
Now, here’s where things get interesting (and by interesting, I mean nerdy in the best possible way). The Osborne Wave isn’t just there to make our EKGs look fancy – it actually tells us something important is going on with the heart’s electrical system.
The Cellular Mechanism
The physiology behind it comes down to a fascinating interplay of cellular mechanisms:
- Ion Channel Temperature Sensitivity:
- The outward potassium current (Ito) in epicardial cells is more sensitive to temperature changes than endocardial cells
- As temperature drops, these Ito channels in epicardial cells stay open longer
- This leads to a more prominent early repolarization in the epicardium (outer layer)
- Transmural Gradient Disruption:
- Normally, there’s a careful balance of ion channels across the heart wall
- In cold conditions, the epicardial action potential notch (phase 1) becomes more pronounced
- This creates a voltage gradient between the epi- and endocardium that manifests as the J-wave
- ATP-Dependent Changes:
- Cold temperatures slow down the Na+/K+ ATPase pump
- This affects the epicardium more than the endocardium due to different cellular densities
- Results in different repolarization timing between the layers
- Calcium Handling:
- Cold temperatures affect calcium channels differently in epi- vs endocardial cells
- The epicardial cells’ calcium channels close earlier in cold conditions
- This contributes to the earlier repolarization of the epicardial layer
When Do We See It?
Here’s where I’ve seen these waves pop up in my career (and trust me, each time was a “well, this shift just got interesting” moment):
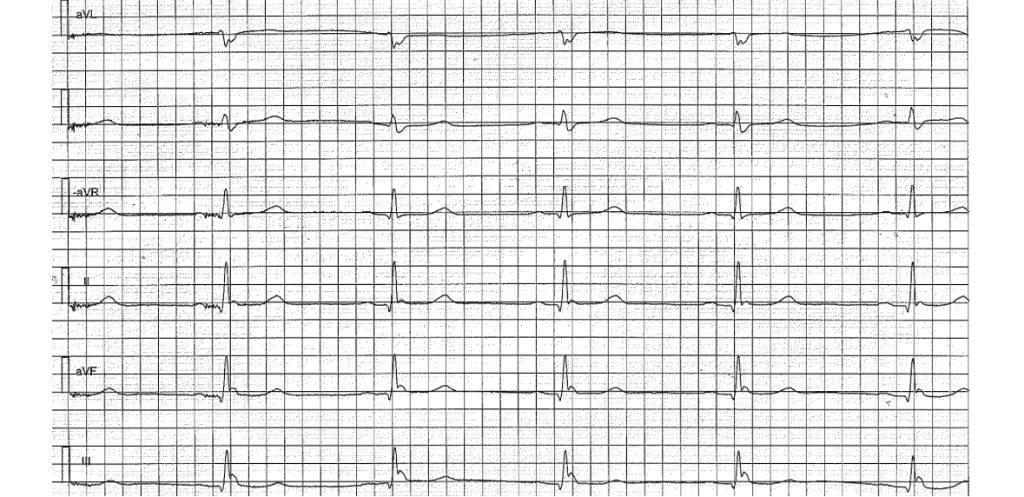
- Hypothermia: By far the most common cause I’ve seen. When your patient’s core temperature drops below 32°C (89.6°F), these waves start showing up like uninvited relatives at a family barbecue. The colder the patient, the more prominent they become.

Hypercalcemia: Because apparently, calcium doesn’t just make your bones strong – it likes to mess with your heart’s electrical system too.
Brain Injuries: Particularly subarachnoid hemorrhages. The brain and heart have this weird relationship where when one’s having a bad day, the other one shows it on the EKG.
Brugada Syndrome: A genetic condition that’s like the ninja of cardiac disorders – sneaky and potentially dangerous.

Why Should We Care?
Here’s the thing – spotting an Osborne Wave isn’t just about showing off your EKG interpretation skills (though that’s definitely a bonus). It’s often an early warning sign that something significant is going on with your patient. In hypothermia cases, for example, the progression of the J-wave can help you track just how cold your patient is getting, which is pretty handy when you’re trying to decide between “grab another blanket” and “time to break out the warm saline.”
Pro Tips From Your Uncle Medic
- If you spot an Osborne Wave, resist the urge to immediately high-five yourself for recognizing it (at least wait until you’re in the supply room). Instead, think about WHY it might be there.
- Consider the context: Is your patient cold? Did they just come from a winter swim? Are they presenting with neurological symptoms?
- Remember that in healthy young athletes, a similar early repolarization pattern can be seen – but context is everything!
References
- Antzelevitch C, Yan GX. J-wave syndromes. Heart Rhythm. 2010;7(4):549-558. doi:10.1016/j.hrthm.2009.12.006
- Osborn JJ. Experimental hypothermia: respiratory and blood pH changes in relation to cardiac function. Am J Physiol. 1953;175(3):389-398.
- Rytand DA. The osborn wave in hypothermia. J Am Coll Cardiol. 1992;19(2):402-403.
- Yan GX, Antzelevitch C. Cellular basis for the electrocardiographic J wave. Circulation. 1996;93(2):372-379.
- Haïssaguerre M, Derval N, Sacher F, et al. Sudden cardiac arrest associated with early repolarization. N Engl J Med. 2008;358(19):2016-2023.
- Gussak I, Antzelevitch C. Early repolarization syndrome: clinical characteristics and possible cellular and ionic mechanisms. J Electrocardiol. 2000;33(4):299-309.
- MacKenzie MA, Aengevaeren WR, Hermus AR, et al. Electrocardiographic changes during steady mild hypothermia and rewarming in the dog. Clin Sci (Lond). 1992;82(4):465-470.
- Rolfast K, Lust E, de Cock CC. Electrocardiographic changes in therapeutic hypothermia. Crit Care. 2012;16(3):R100.
Note: This blog is for educational purposes only and should not be used as a substitute for professional medical advice. Always consult with appropriate medical professionals for clinical decisions.
Stay safe out there, and keep those eyes peeled for dancing dolphins on your EKG strips!
P.S. If you ever find yourself explaining the Osborne Wave to a student, feel free to use my “dolphin jump” analogy. It’s gotten me through more teaching shifts than I care to admit!

